Concept Maps & Diagrams
-
![inflam and wound healing]()
Innate Immune System Response to Tissue Injury
This concept map provides a comprehensive overview of the innate immune response to injury, delineating key pathways and their interconnections. It generally classifies the response into categories such as adaptive immunity, wound healing, the complement cascade, the coagulation cascade, and the kinin-bradykinin system—elucidating their respective roles in mounting a defense against tissue injury and infection. Furthermore, this map links these pathways to their “patho-toxic” (bactericidal) endpoints as well as related clinical manifestations, disease processes, and treatments.
Made with GoodNotes for iPad.
-
![FirstTriBleeding]()
Clinical Approach to First Trimester Bleeding
This is a clinical flowchart that offers a general approach to understanding, assessing, and managing patients experiencing bleeding in the first trimester of pregnancy. It outlines clinical signs, symptoms, risk factors, and management options. This flowchart also emphasizes specific clinical values that are crucial in determining appropriate management strategies frequently tested on the NBME OBGYN Subject and USMLE Step 2 examinations.
Made with GoodNotes for iPad.
-
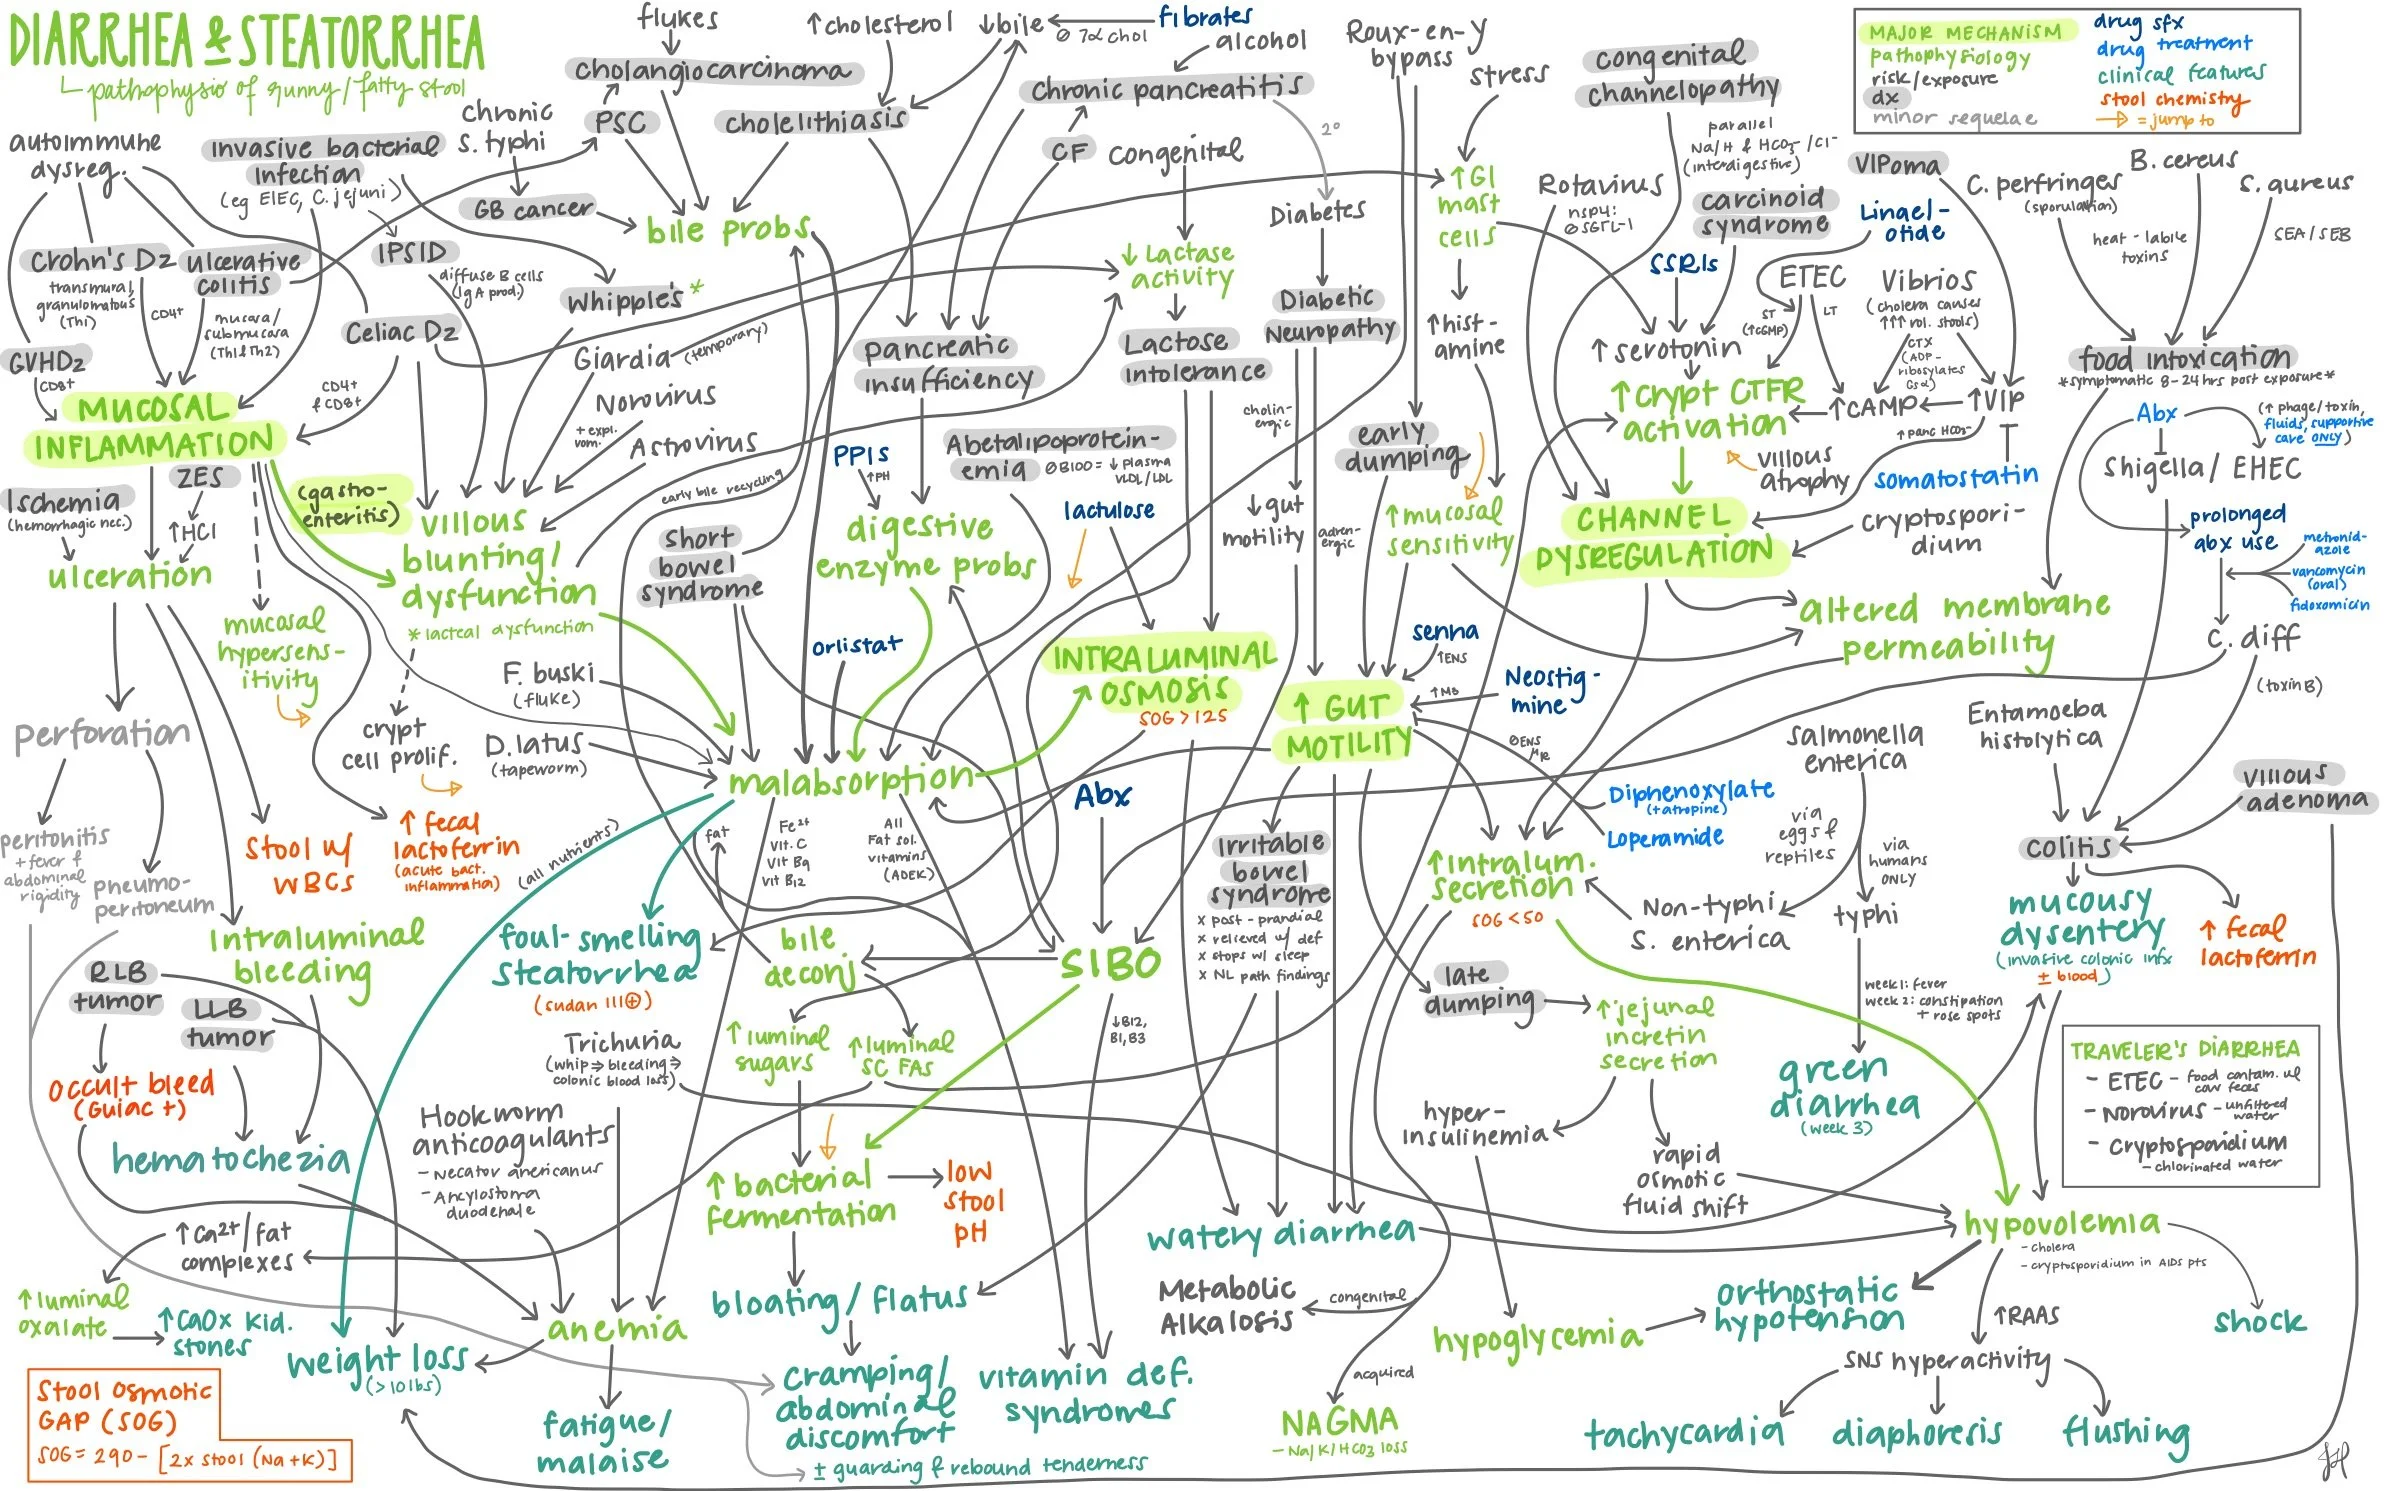
![diarrhea pathomap]()
Diarrhea Patho-Map
This map outlines the multifactorial pathophysiology of diarrhea and steatorrhea. It depicts the complex interplay of pathophysiological mechanisms that underline these common GI disorders. The diagram categorizes the causes into three main groups: inflammatory conditions, metabolic disorders, and bacterial pathogens. It also ties the underlying causes to their respective clinical manifestations.
Made with GoodNotes for iPad.
-
![Knee Path]()
Knee Pathology
This pictogram represent different knew conditions that may manifest in different areas of the knee joint.
Made with GoodNotes for iPad.
-
![Circle of Willis]()
Cerebrovascular Circle (of Willis)
This diagram is a comprehensive pictographic representation of the Circle of Willis (COW), a vital neuromuscular network located at the base of the brain. The diagram highlights the potential consequences that may arise due to vessel damage during strokes. By visually indicating which brain regions are affected, viewers gain insight into functional defects as it relates to the major branches of the COW and their relation to certain cranial nerves.
Made with GoodNotes for iPad.
-
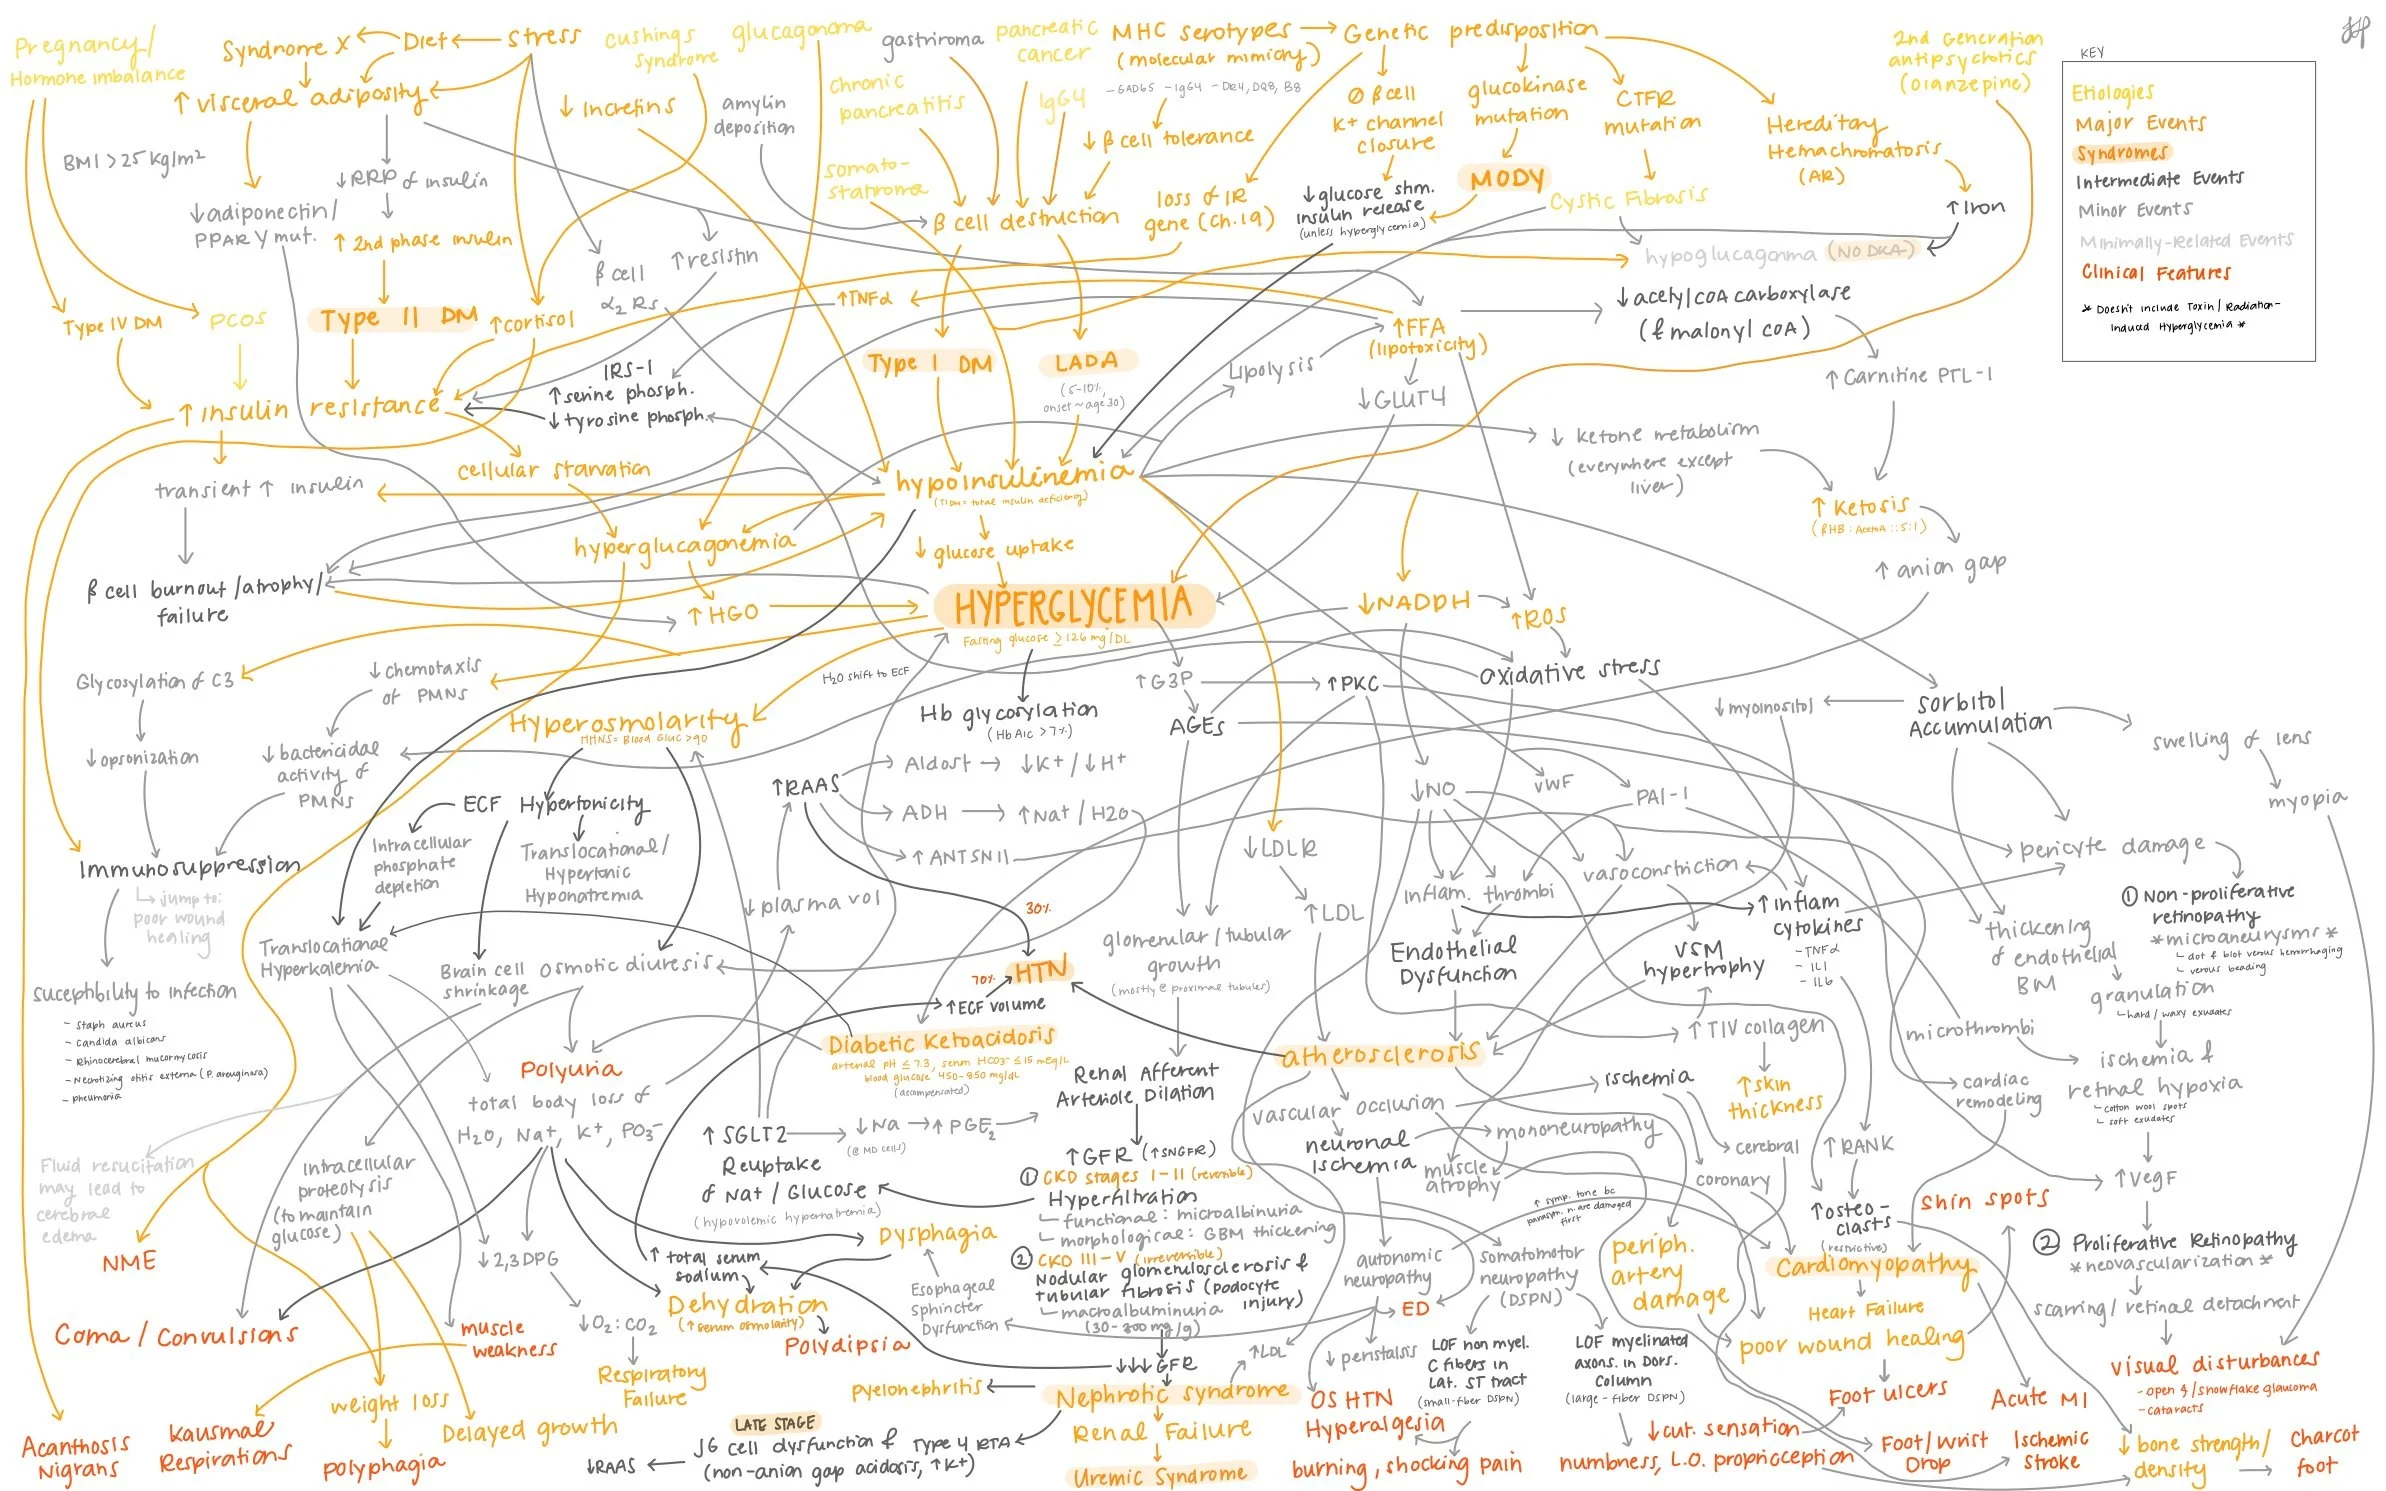
![]()
Hyperglycemia and Diabetes
This comprehensive concept map represents the intricate web of pathophysiological events that occur in hyperglycemia and diabetes. It encompasses key processes of the immune system, renal/glomerular apparatus, electrolyte homeostasis mechanisms, and mediators od endovascular injury. This diagram also emphasizes the clinical implications of hyperglycemia as manifested in acute hyperglycemic states and chronic microvascular disease.
Made with GoodNotes for iPad.
-
![]()
The Nephron
This pictogram offers a detailed representation of the glomerular-tubular units of the kidney, illustrating its distinctive functional sections and their roles in facilitating electrolyte imbalance, excretion, and water homeostasis. Each section is highlighted to showcase the intricate molecule exchange across various cell membranes , proving content on how specific cell groups respond to autonomic signals.
Made with GoodNotes for iPad.
See remastered/print version here.
Teaching a concept that needs a visual aid?
Visit the contact page to connect with me.


